The premarket desk for small-cap momentum traders.
Six screens built around one question: which names are in play this morning, and where do they break. Live top gainers, a momentum scanner, support and resistance from every timeframe on every chart, watchlists that alert, and the news read for you.
See the screens PricingIn private use today. Public access opens once the data licences for other users are in place.
What it does
Everything runs live from the open of the premarket at 4:00 New York time. Nothing to click through: each screen fills itself.
Top gainers, live
The market's six biggest gainers on the day, ranked every few seconds from the live stream, each with its chart, float, volume, rotation, dilution risk and news score. The order changes as the ranks change.
The main chart
One stock full-window. Send any name to it with one click from any other screen. Every candle moves with the trades, down to 10-second bars.
Momentum scanner
What is moving right now: every stock scored every five seconds on its 1- and 5-minute change, volume against normal, and a new high of day. Six slots that fill themselves without flicker.
Levels from every timeframe
The major support and resistance from the yearly, quarterly, monthly, weekly and daily charts drawn on the lower timeframes as soft grey bands, with a letter telling you which timeframe they come from.
Watchlists with AutoAlert
Grids of 6 to 24 charts. Draw a line or a level, approve it, and get told when price tests it, breaks it on a close, or fails. Sound and a notification on every screen.
Scanners and news
A stream of hits: new highs of day, one-minute moves, low-float movers. Alongside, the news for each name scored 1 to 10 and summarised in a few words, labelled as AI-generated.
The screens
Dark by default, no chrome. The charts are the point; the numbers sit in fixed places around them.
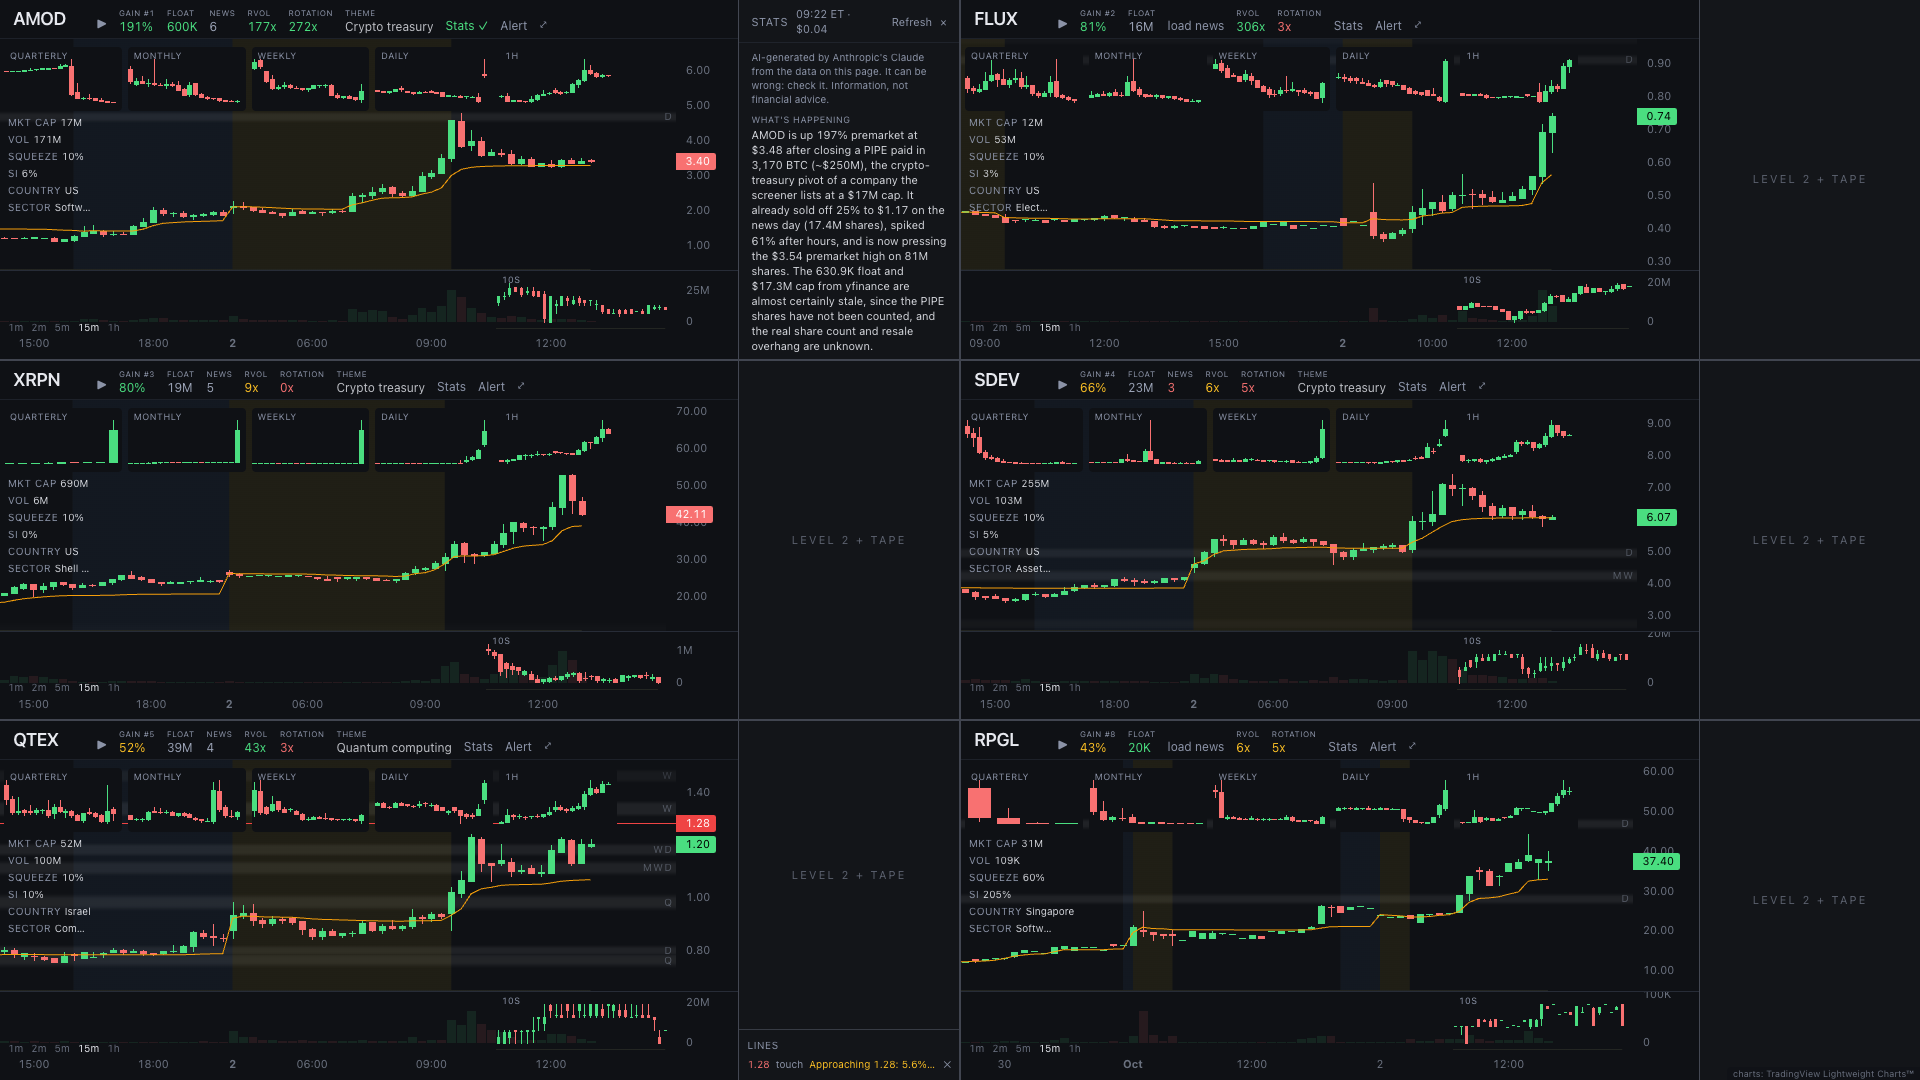
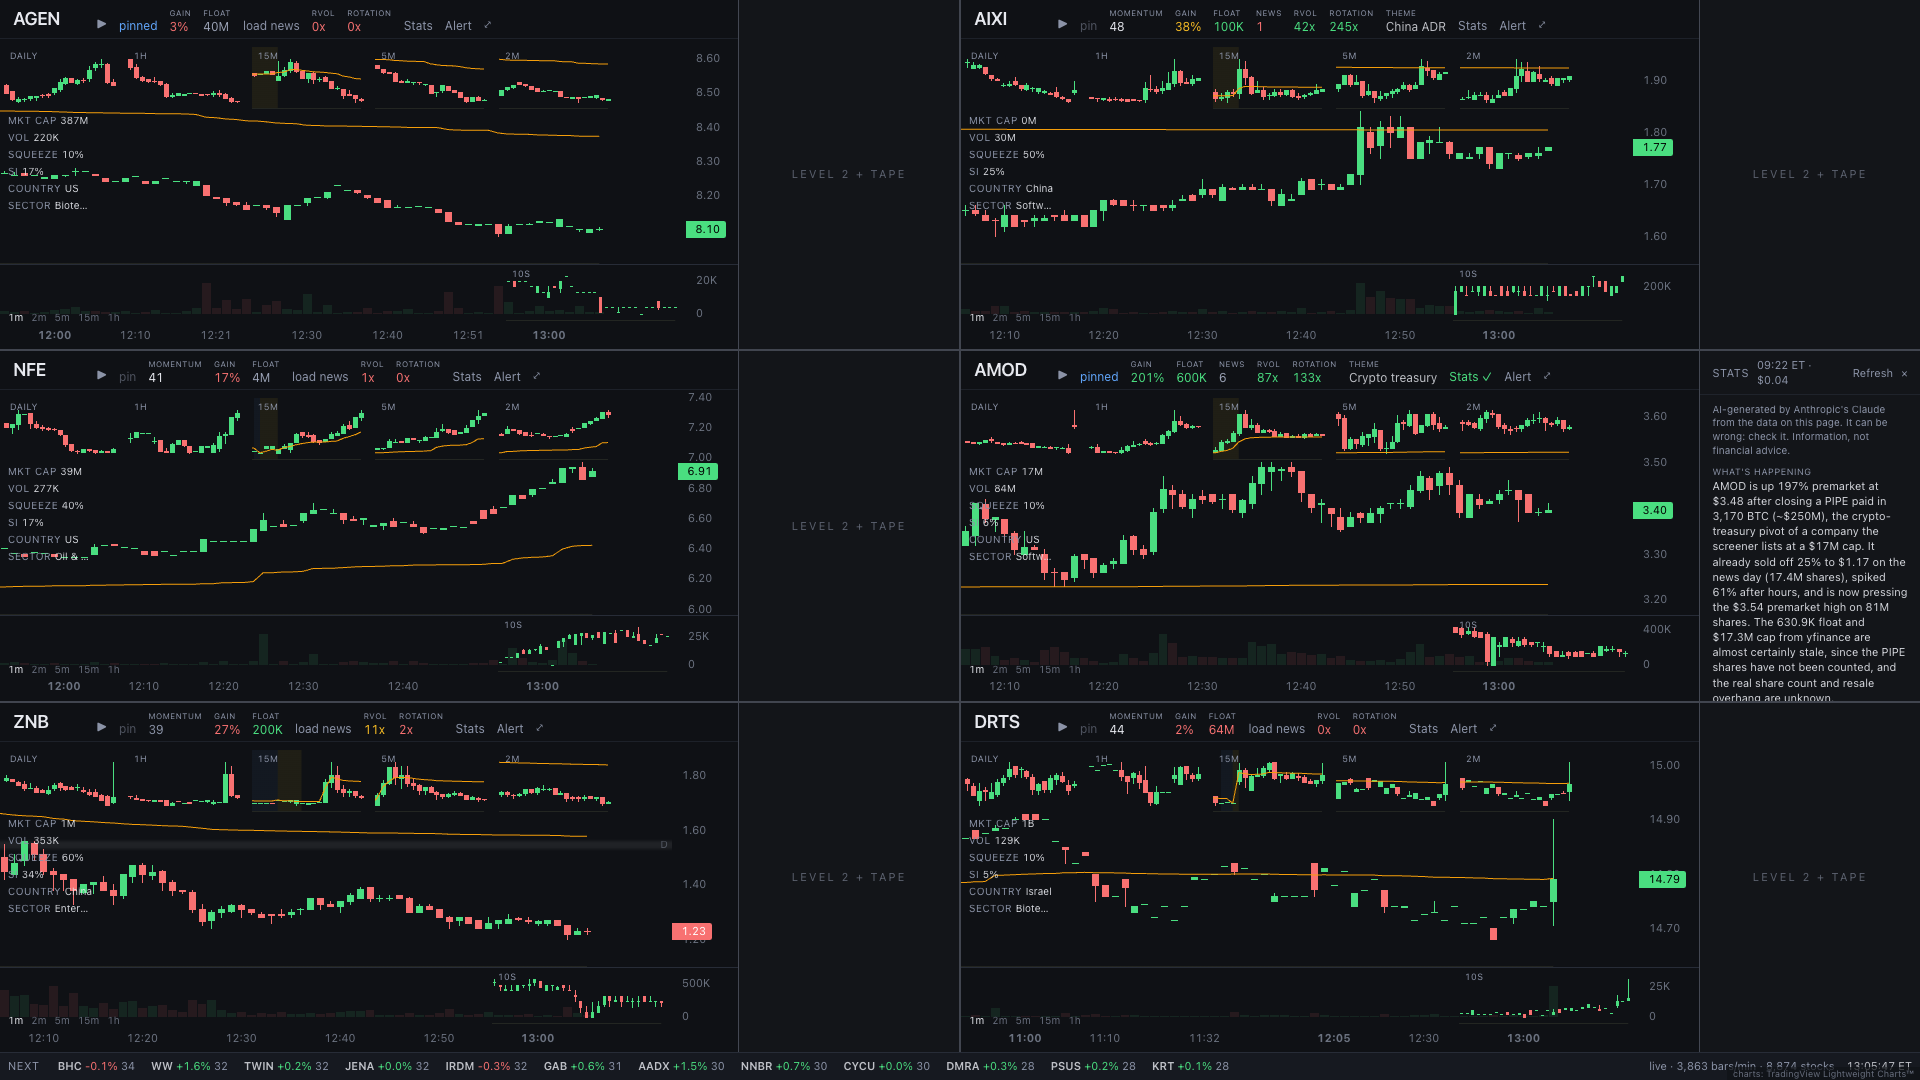
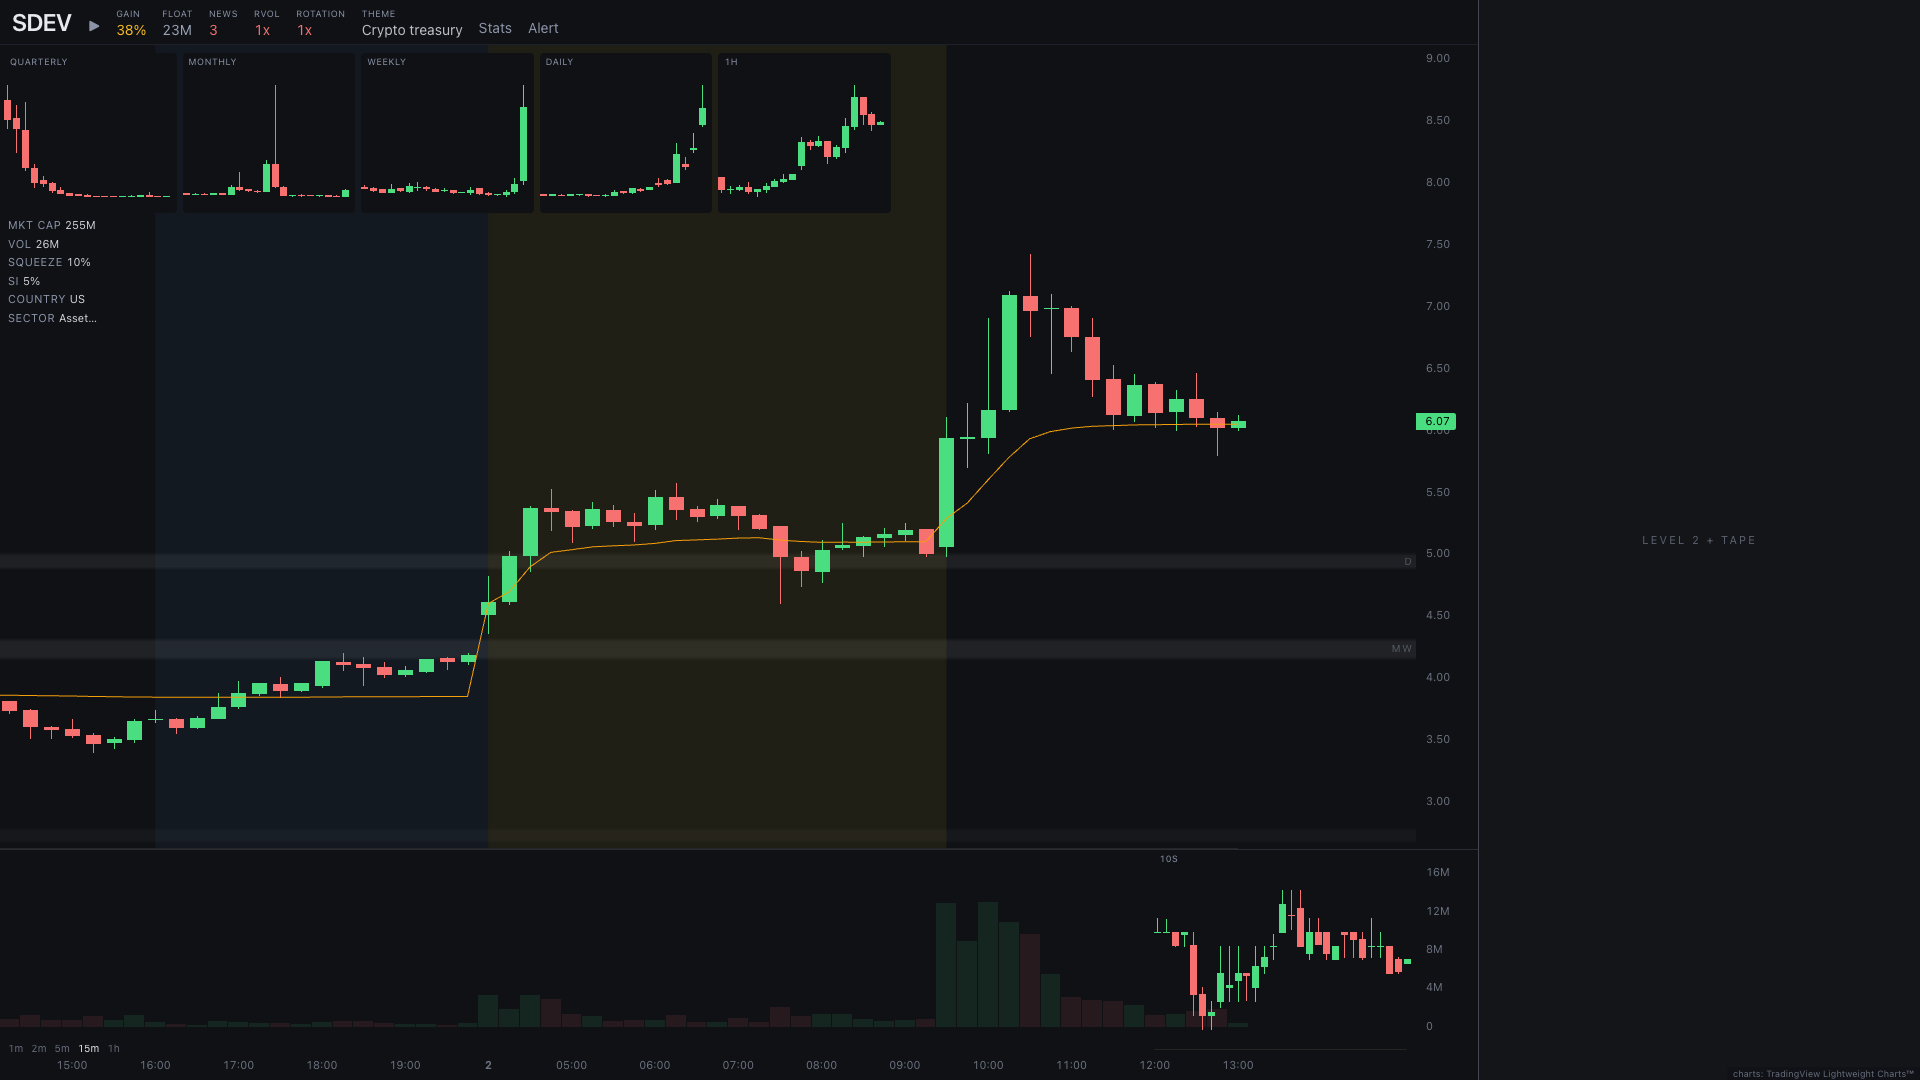
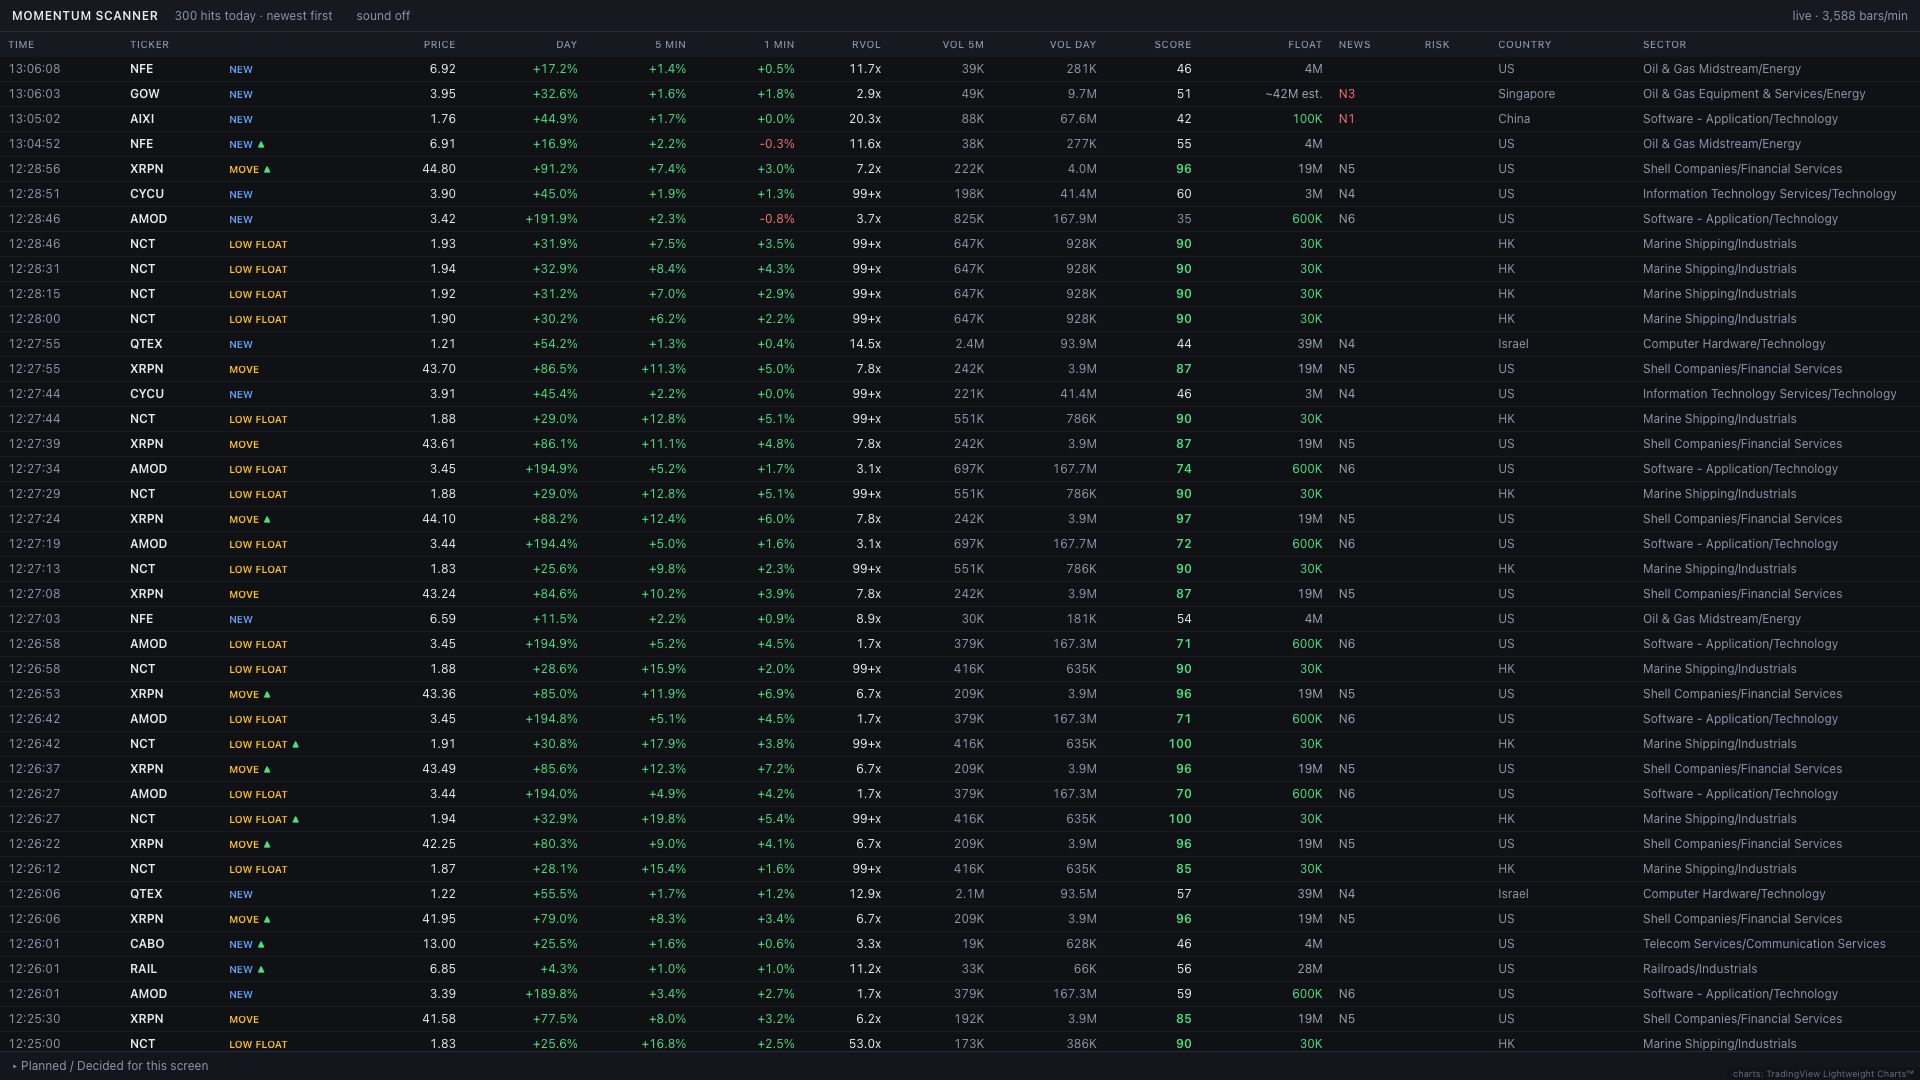
Screens shown as they looked on a trading day, for illustration.
Pricing
One plan, every screen. Indicative pricing while the desk is in private use.
- All six screens and every feature
- Live US market data during the session
- AI-read news and stock reads, clearly labelled
- Cancel any time
- Everything in Monthly
- Two months free
- Priced per billing period, VAT shown at checkout
Payments are not open yet: the checkout page is a preview and takes no details.